![]()
Sponsored By
ROCK
HARDWARE
Chockstone Photography
Australian Landscape Prints |
 Chockstone Forum - General Discussion
General Climbing Discussion
| Topic | Date | User |
| OT: Moorabal/Lal Lal wind farm | 5-Jun-2009 At 12:11:50 PM | TonyB |
| Message | ||
| On 5/06/2009 evanbb wrote: >>Firstly here's a graph from the IPCC. It shows how temperatures were >>much higher than currently during the Medieval warm Period. >Now, I know this is a harsh term, but I think you're pulling a furphy >here. That graph is not from the IPCC. I can assume you the graph was in the 1990 IPCC report. It was later seen as something of an embarassment as you can imagine. Perhaps this is the reason that the 1990 report is not available from the IPCC web site ... you have to buy it. >To summarise; you have disproven the IPCC, using 20 year old IPCC data, The data for the 1990 graph is 2000 years old. >by graphing 2 periods, without axes (axiis? what's the plural of axis?) The axes were deleted for the quiz. The abscissa is 1910 to 1940 on the first and 1989 to 2009 on the second. The ordinates for both graphs are in tenths of a degree. The important fact to draw from the graphs is that there is no increase in temperature rise due to man's fossil fuel burning. >or any margins of error, or any real notion of where the data came from, The data is from IPCC/Hadley?UK Met Office, as given in my earlier link. The data tables do not include errors, however it does include a link to a paper which discusses errors ... this paper contains serios errors. The station data study link I provided gives a much more realistic indication of data errors. >Those 2 shiity graphs completely overturn a hypothesis that ... Exactly. They overturn a hypothesis that man's CO2 is causing warming. There is no evidence to the contrary. As have said many times, please show me if you can find any. There's actually many thousands of scientists producing lots of other shitty graphs highlighting the rubbish of the IPCC hypothesis. Here's another shitty graph for you showing the nonsense of the IPCC forecasts, that are the basis for a recommended new tax on every Australian Taxpayer of $2056 PER ANNUM (Productivity Council of Oz). 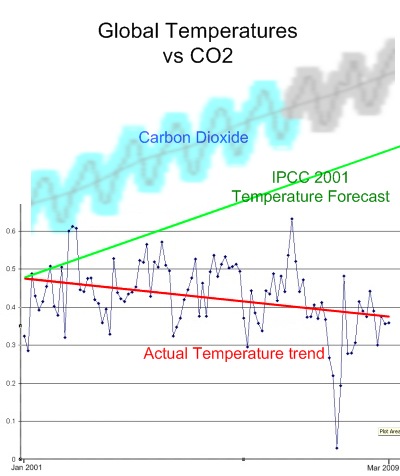 |
||
Home | Guide | Gallery | Tech Tips | Articles | Reviews | Dictionary | Forum | Links | About | Search
Chockstone Photography | Landscape Photography Australia | Australian Landscape Photography | Landscape Photos Australia
Please read the full disclaimer before using any information contained on these pages.
Australian Panoramic |
Australian Coast |
Australian Mountains |
Australian Countryside |
Australian Waterfalls |
Australian Lakes |
Australian Cities |
Australian Macro |
Australian Wildlife
Landscape Photo |
Landscape Photography |
Landscape Photography Australia |
Fine Art Photography |
Wilderness Photography |
Nature Photo |
Australian Landscape Photo |
Stock Photography Australia |
Landscape Photos |
Panoramic Photos |
Panoramic Photography Australia |
Australian Landscape Photography |
High Country Mountain Huts |
Mothers Day Gifts |
Gifts for Mothers Day |
Mothers Day Gift Ideas |
Ideas for Mothers Day |
Wedding Gift Ideas |
Christmas Gift Ideas |
Fathers Day Gifts |
Gifts for Fathers Day |
Fathers Day Gift Ideas |
Ideas for Fathers Day |
Landscape Prints |
Landscape Poster |
Limited Edition Prints |
Panoramic Photo |
Buy Posters |
Poster Prints