![]()
Sponsored By
ROCK
HARDWARE
Chockstone Photography
Australian Landscape Prints |
 Chockstone Forum - General Discussion
General Climbing Discussion
| Topic | Date | User |
| OT: Moorabal/Lal Lal wind farm | 31-May-2009 At 3:24:42 PM | Ni |
| Message | ||
| On 29/05/2009 TonyB wrote: >Data below (blue spots) is monthly global temperature data taken from Hadley >Centre / UK Met Office / IPCC. Red lines show temperature trends. Data >is over a 30 year period for each graph. One graph is the past 30 years. > The other graph is for a much earlier 30 year period, before the major >increase in man's CO2 output. ( I hope that is explicit enough ?) > >Possible responses: > >a) Left graph shows greatest warming >b) Right graph shows greatest warming >c) There is no discernable difference in the rate of warming over the >past 30 years and the much earlier 30 year period. > > 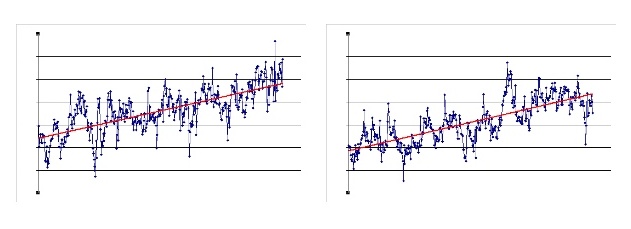 Homework for this week: Go to your maths textbook and look up the formula for the confidence interval for the difference in slopes. Then re-write your posts on this subject. Additional homework related to previous posts: Look up sea level data for the last century. (arguably better than surface temperature measures) Then re-write your previous posts on polar ice and rates of temperature change. (remember to allow for thermal expansion of sea water in your calculations) Amend your posts to include other green house gases, particularly methane and nitrous oxide. Look up when the current rises in atmospheric levels of these began (hint: not long after the industrial revolution) Amend your comments on temperatures in the last decade by including consideration of the SOI (+/- atmospheric particulate pollution) Re your suggestion that increasing greenhouse gas levels are the result of cyclical warming (melting of tundra etc) rather than a cause of it, explain why previous cyclical warming of the earth did not result in high greenhouse gas levels. You mention very high levels of CO2 early in the earth's history. Add comments about whether these levels were compatible with human life. CO2 levels since 1960 exceed levels seen at any prior time since humans evolved. Given that humans have never lived on a planet with 0.06% CO2 , what do you predict the long term effects will be, if CO2 reaches that level? Home work is due Friday week your teacher (ps I will definitely not be responding to any human evolution skeptics) |
||
Home | Guide | Gallery | Tech Tips | Articles | Reviews | Dictionary | Forum | Links | About | Search
Chockstone Photography | Landscape Photography Australia | Australian Landscape Photography | Landscape Photos Australia
Please read the full disclaimer before using any information contained on these pages.
Australian Panoramic |
Australian Coast |
Australian Mountains |
Australian Countryside |
Australian Waterfalls |
Australian Lakes |
Australian Cities |
Australian Macro |
Australian Wildlife
Landscape Photo |
Landscape Photography |
Landscape Photography Australia |
Fine Art Photography |
Wilderness Photography |
Nature Photo |
Australian Landscape Photo |
Stock Photography Australia |
Landscape Photos |
Panoramic Photos |
Panoramic Photography Australia |
Australian Landscape Photography |
High Country Mountain Huts |
Mothers Day Gifts |
Gifts for Mothers Day |
Mothers Day Gift Ideas |
Ideas for Mothers Day |
Wedding Gift Ideas |
Christmas Gift Ideas |
Fathers Day Gifts |
Gifts for Fathers Day |
Fathers Day Gift Ideas |
Ideas for Fathers Day |
Landscape Prints |
Landscape Poster |
Limited Edition Prints |
Panoramic Photo |
Buy Posters |
Poster Prints